"We have the data, but nobody to analyze it." "We get as far as Excel pivot tables, but never reach insights that drive decisions." If that sounds familiar, you are describing the most common way data initiatives stall.
This guide explains how to delegate data analysis to an AI agent: from importing CSV/Excel files, through automated exploratory data analysis (EDA), interactive dashboards, large-scale analysis on BigQuery, all the way to auto-generated reports. The content is based on the training materials (Module 8) we use in our corporate training and online course.
For the fundamentals of working with AI agents, see The Complete Guide to AI Agents for Business.
What you will learn
- What AI data analysis is (in one sentence)
- Why AI changes analysis — the generate → run → review → iterate loop
- The end-to-end workflow (5 steps)
- Delegating EDA (exploratory data analysis) to AI
- Building interactive dashboards with Marimo
- Analyzing large datasets with BigQuery
- Auto-generating Markdown analysis reports
- Operating safely
What is AI data analysis?
AI data analysis is a technology where AI reads your Excel/CSV files or database data and performs the analysis and visualization for you. You get insights without complex formulas or programming.
Sales trend analysis, survey aggregation, automatic chart generation, anomaly detection — work that used to require a specialist can now run on your own desk.
Its most underrated strength: it works even when you don't know what to ask. Hand over the data and say "tell me anything interesting," and the AI proposes angles of analysis. The entry requirement has shifted from technical skill to the ability to ask questions.
Why AI changes analysis — the automated loop
When an AI agent runs your analysis, four steps loop automatically:
| Step | What the AI does |
|---|---|
| 1. Generate code | Writes the Python analysis code needed for EDA |
| 2. Execute immediately | Runs the code and retrieves results |
| 3. Review results | Inspects the output and decides the next analysis step |
| 4. Visualize | Creates graphs and charts without manual intervention |
The old cycle — "ask an analyst, wait days, review, ask again" — becomes an iteration measured in minutes, because the AI looks at its own results and moves to the next analysis. Your role is steering: "dig deeper into this segment."
The end-to-end workflow
The standard workflow in our course has five steps:
- Import — load Excel / spreadsheet data with pandas into a Marimo notebook (including type conversion and missing-value handling)
- Authenticate — set up GCP authentication with the gcloud CLI if you use BigQuery
- Retrieve data — run SQL queries against BigQuery
- Explore — EDA plus hypothesis deep dives: LTV, age groups, attribute cross-tabs, simple regression
- Visualize — turn findings into charts and dashboards with Marimo / Plotly
One ground rule from the start: practice with public-safe data (fictional or officially open datasets). Never use real data that can identify individuals.
Delegating EDA to AI
EDA (Exploratory Data Analysis) is the first stage of any analysis: reviewing statistics, distributions, and correlations to understand the overall shape of the data.
The instruction to the agent can be a single sentence:
Run exploratory data analysis (EDA) on this CSV file. Automatically perform basic statistics, missing value checks, distribution analysis, correlation analysis, and visualization.
From that one prompt, the AI executes in order:
- Basic statistics (mean, variance, min/max)
- Missing-value checks and handling
- Distribution and correlation analysis
- Visualization (histograms, scatter plots, heatmaps)
You can push one step further into hypothesis testing. With e-commerce style customer data, for example, the agent can cross-analyze LTV and retention-style metrics against age groups and attributes, then use simple regression to identify likely drivers — all in one request, with results output as Markdown tables.
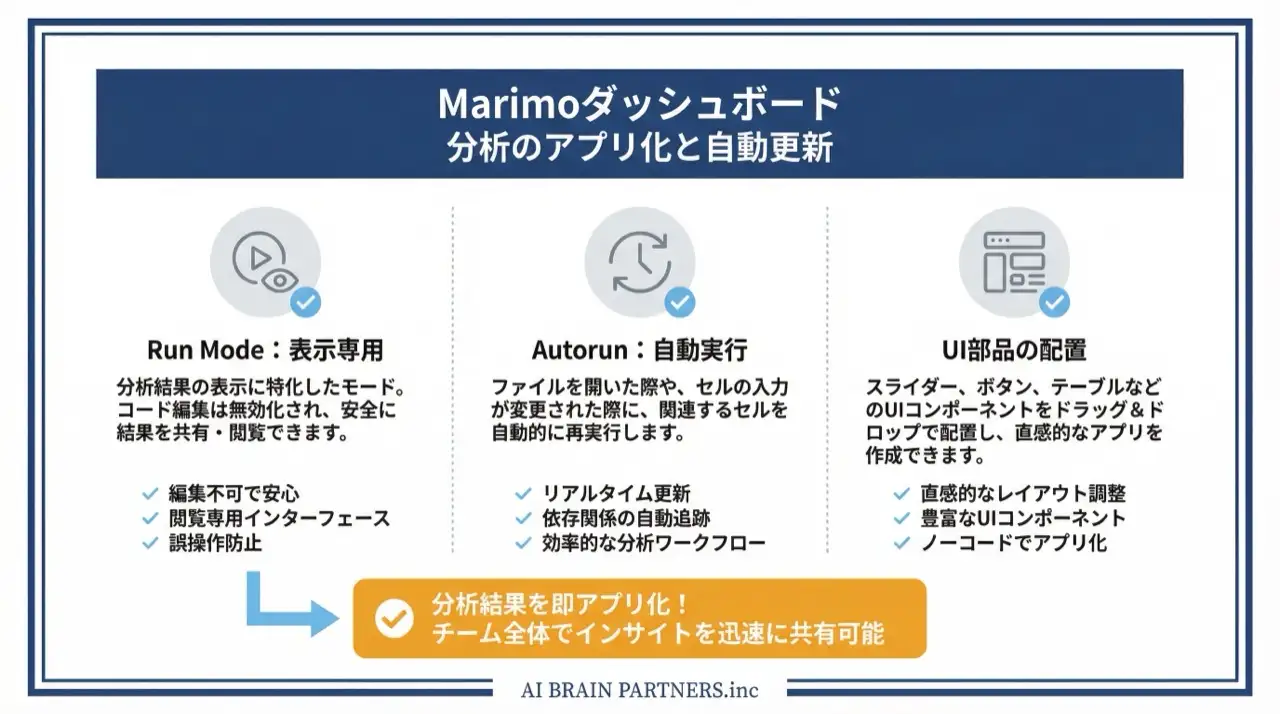
Building interactive dashboards with Marimo
To turn analysis into something shareable rather than a one-off, the course uses Marimo, a Python notebook.
Marimo is a tool for building interactive, reproducible notebooks — it preserves the dependency graph (DAG) between cells, so you can build reactive data applications and edit them in the browser via the marimo edit command.
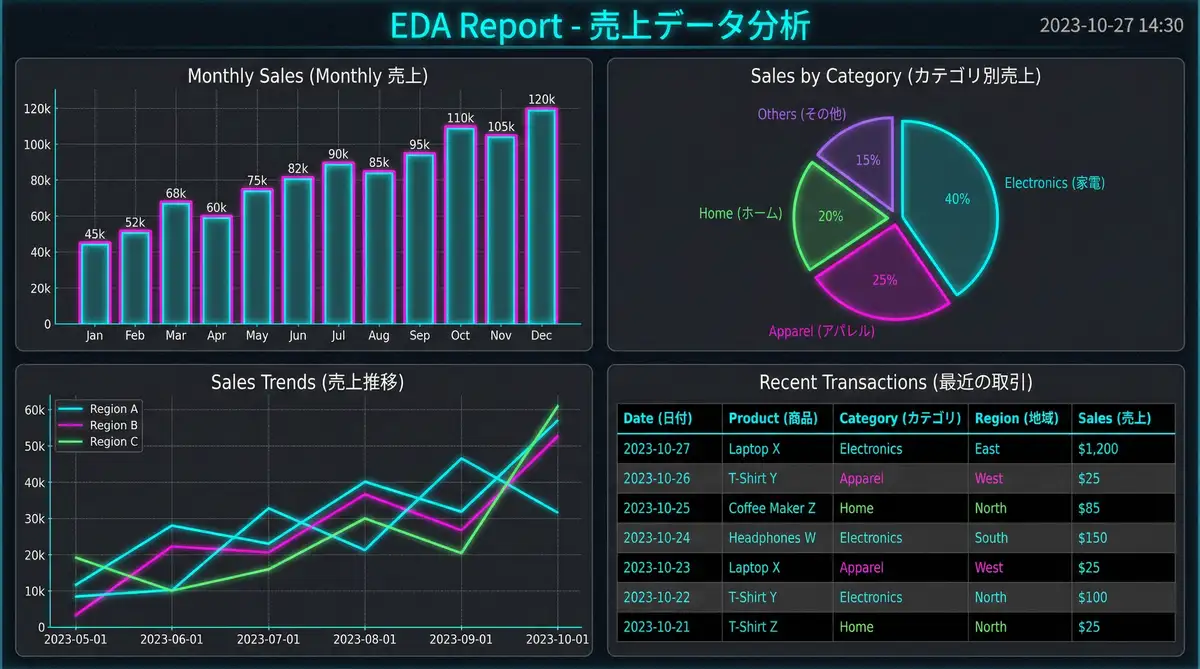
For a sales dashboard, the request looks like this:
Create a Marimo notebook and build an interactive sales data dashboard (monthly sales charts, regional filters, KPI cards)
Typical building blocks:
- Monthly sales charts (line and bar graphs)
- Regional filters (dropdown)
- KPI cards (total sales, month-over-month, target achievement rate)
- Sliders and reactive graphs for interactive exploration
Individual charts come from libraries like matplotlib, seaborn, and Altair, laid out in a Marimo dashboard as a shareable view.
Analyzing large datasets with BigQuery
Data too large for Excel goes to Google BigQuery. Once GCP authentication is set up via the gcloud CLI, the AI agent handles SQL query writing, execution, and visualization.
For practice, BigQuery offers public datasets. The course exercise uses bigquery-public-data.samples.natality (birth data) to aggregate generational trends with SQL and chart the time series with Plotly.
Three practical tips from the course materials:
- Always use parameterized queries
- Limit query results during exploration (avoid unnecessary scans)
- Use Marimo's cache for large datasets
Auto-generating Markdown reports
The final stage of analysis is reporting — and it can be delegated too. After running the analysis, ask the agent to compile the results, and it generates a structured Markdown report:
- Executive summary — the conclusions
- Key findings — data-driven insights
- Recommendations — next actions
- Appendix — methodology and data sources
Chaining "analysis → report" into one workflow effectively automates weekly and monthly reporting. To automate the data-retrieval side as well — pulling from Google Sheets on a schedule — combine this with the patterns in AI Secretary: Automate Gmail, Calendar & Drive and Automate Your Work with Google Apps Script and AI.
Operating safely
- Never practice on personally identifiable data — establish the workflow with fictional or open data first
- Humans verify the numbers — don't feed AI aggregations straight into executive decisions; cross-check critical figures against source data
- Watch query costs — BigQuery bills by data scanned, so limit results while exploring
- Keep reproducibility — saving the analysis as a Marimo notebook lets anyone re-run it
For team-wide enablement with hands-on guidance, see our corporate AI agent training.
Frequently asked questions
Q. Can I do AI data analysis without programming skills? A. Yes. The AI agent generates and executes the analysis code; your job is to articulate what you want to know from the data. Even a vague request like "tell me anything interesting" works — the AI proposes angles and proceeds, asking you for direction along the way.
Q. What exactly is EDA? A. EDA (exploratory data analysis) is the first stage of analysis: reviewing basic statistics, missing values, distributions, and correlations to understand the shape of your data. Delegated to an AI agent, the whole sequence — from statistics to visualizations like histograms, scatter plots, and heatmaps — runs automatically from a single prompt.
Q. Can AI analyze my Excel or spreadsheet data? A. Yes. The standard flow is to load CSV/Excel files with pandas, apply type conversion and missing-value handling, and bring the result into a Marimo notebook. Data living in Google Sheets can be retrieved first and fed into the same workflow.
Q. How much can I trust AI analysis results? A. The computation itself runs as code, so it is reproducible. Interpretation and choice of angle, however, can contain errors. Cross-check important figures against source data and have a human review report conclusions before they feed decisions.
Q. Does this work for large datasets? A. Yes — data beyond Excel's limits moves to BigQuery, where the agent aggregates with SQL before visualizing. BigQuery's public datasets are a good practice ground, as long as you keep an eye on scan-based billing.
Related articles
- The Complete Guide to AI Agents for Business
- AI Secretary: Automate Gmail, Google Calendar & Drive
- Automate Your Work with Google Apps Script and AI
- Notion x AI: Automating Databases and Page Generation
- Corporate AI agent training (hands-on)
Related services
Ready to put AI agents to work?
Turn what you just read into real workflows. AI Agent Camp helps non-technical professionals go from using to building — hands-on.
Last reviewed: 2026-06-10